With the success of the Questrade IQ web platform, customers were demanding a tool that was even more powerful and versatile. More experienced, active investors required more robust research and analysis tools that could keep up with their demands.
It was clear that we had to meet the needs of our customers who were more experienced investors, but we wanted to design a product that still appealed to less-experienced users and facilitated learning and education to support their growth as their experience level grew as investors.
User research and analysis was key to the success of this project. We had to revisit our user personas to identify and account for the segment of the market whose needs were not being fulfilled. Through detailed research and analysis with our internal customer-facing teams and user interviews with real users and potential customers, we identified sufficient behavioral variables to segment our uses into 3 different archetypes with varying user needs, desires, lifestyles, and goals. The personas were used constantly throughout the design process to guide decisions, prioritize functions, validate solutions, and create empathy amongst the team.
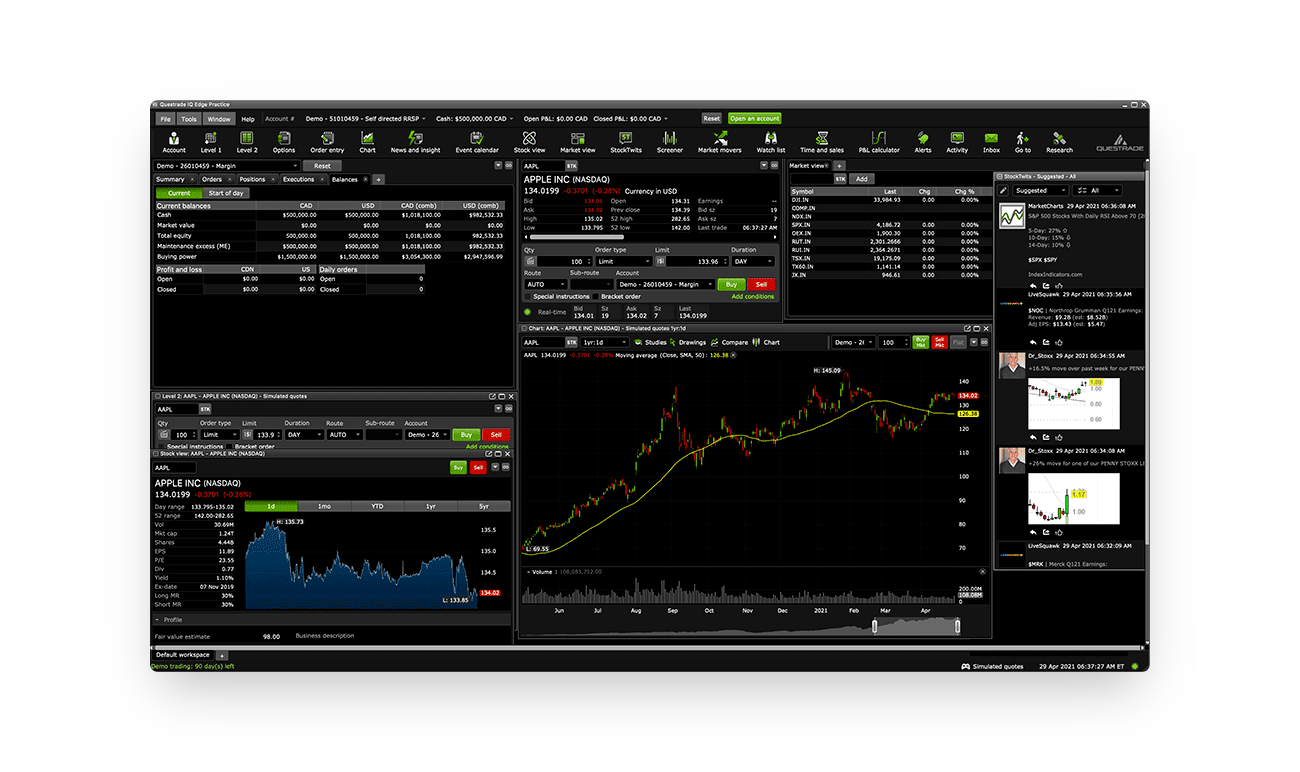
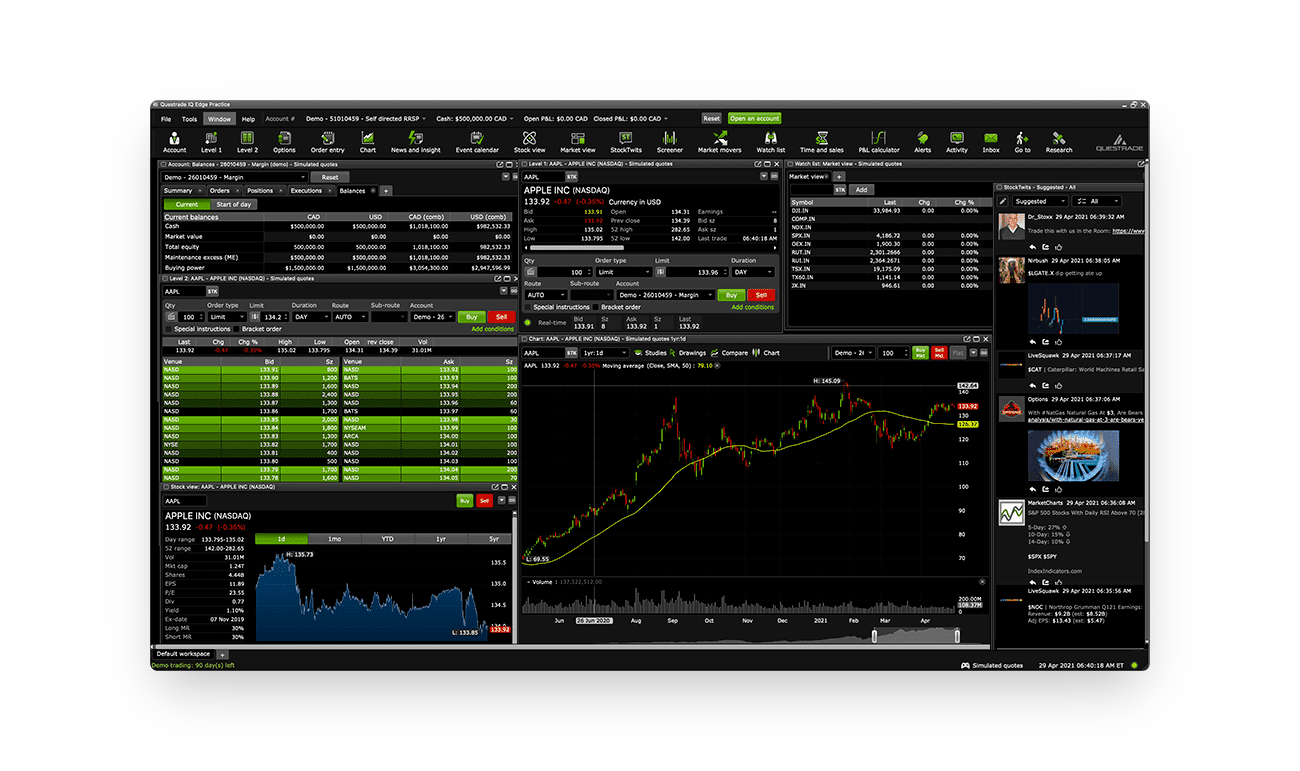
User analysis in-hand, we began identifying the research and analysis tools that would provide users with a more robust, powerful trading experience. To the layperson, or a beginner-level trader, the advanced tools were complex and data-heavy. The strategy was to present these tools in a way that simplified and narrowed their scope for the less-experienced investor, whilst affording the more experienced investor the ability to utilize the full-breadth of their power.
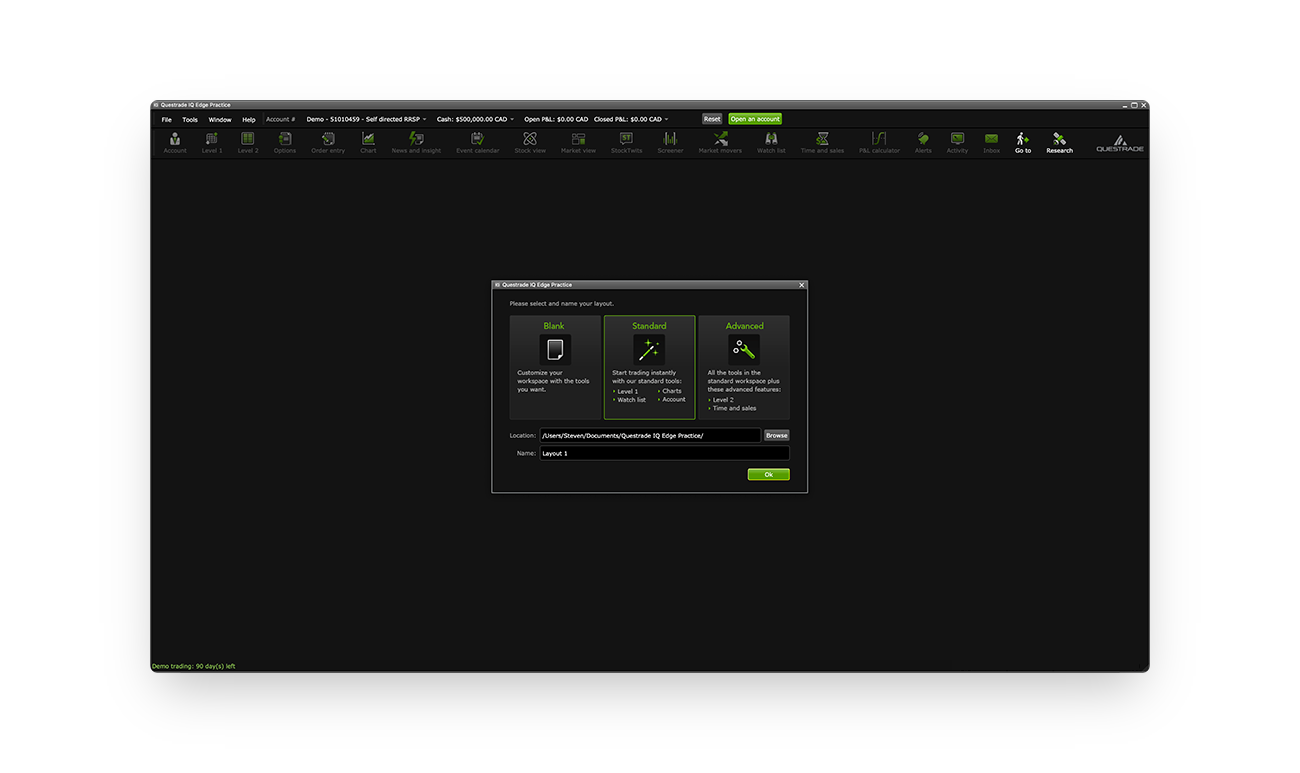
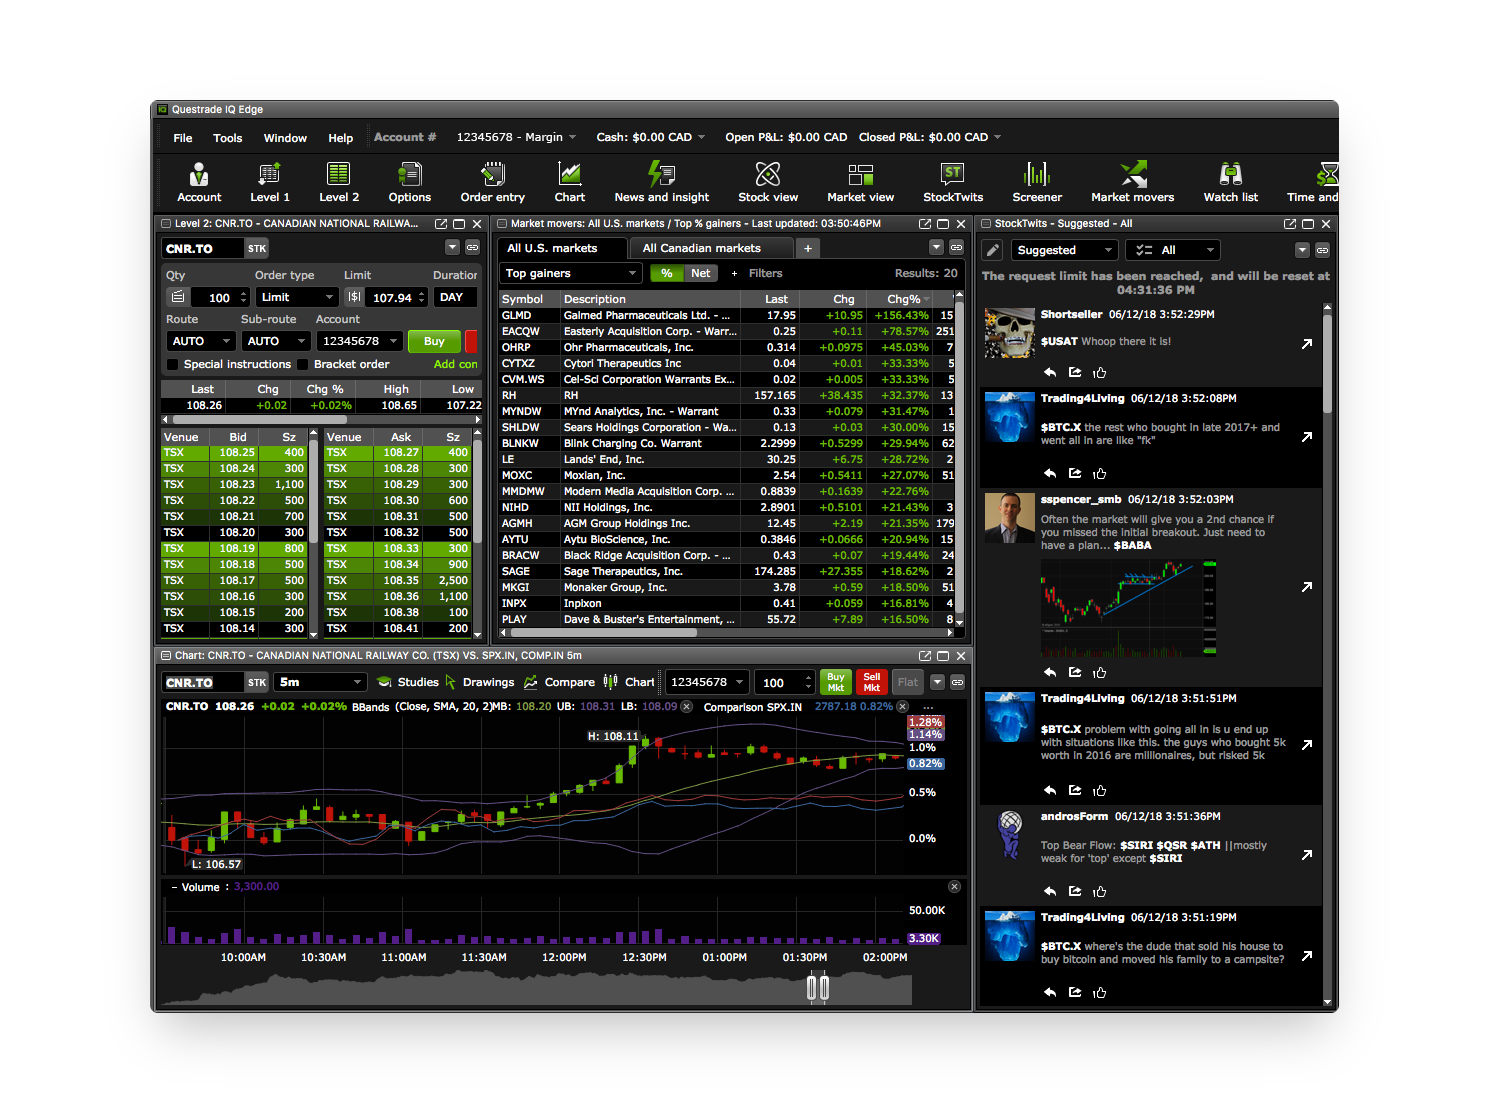
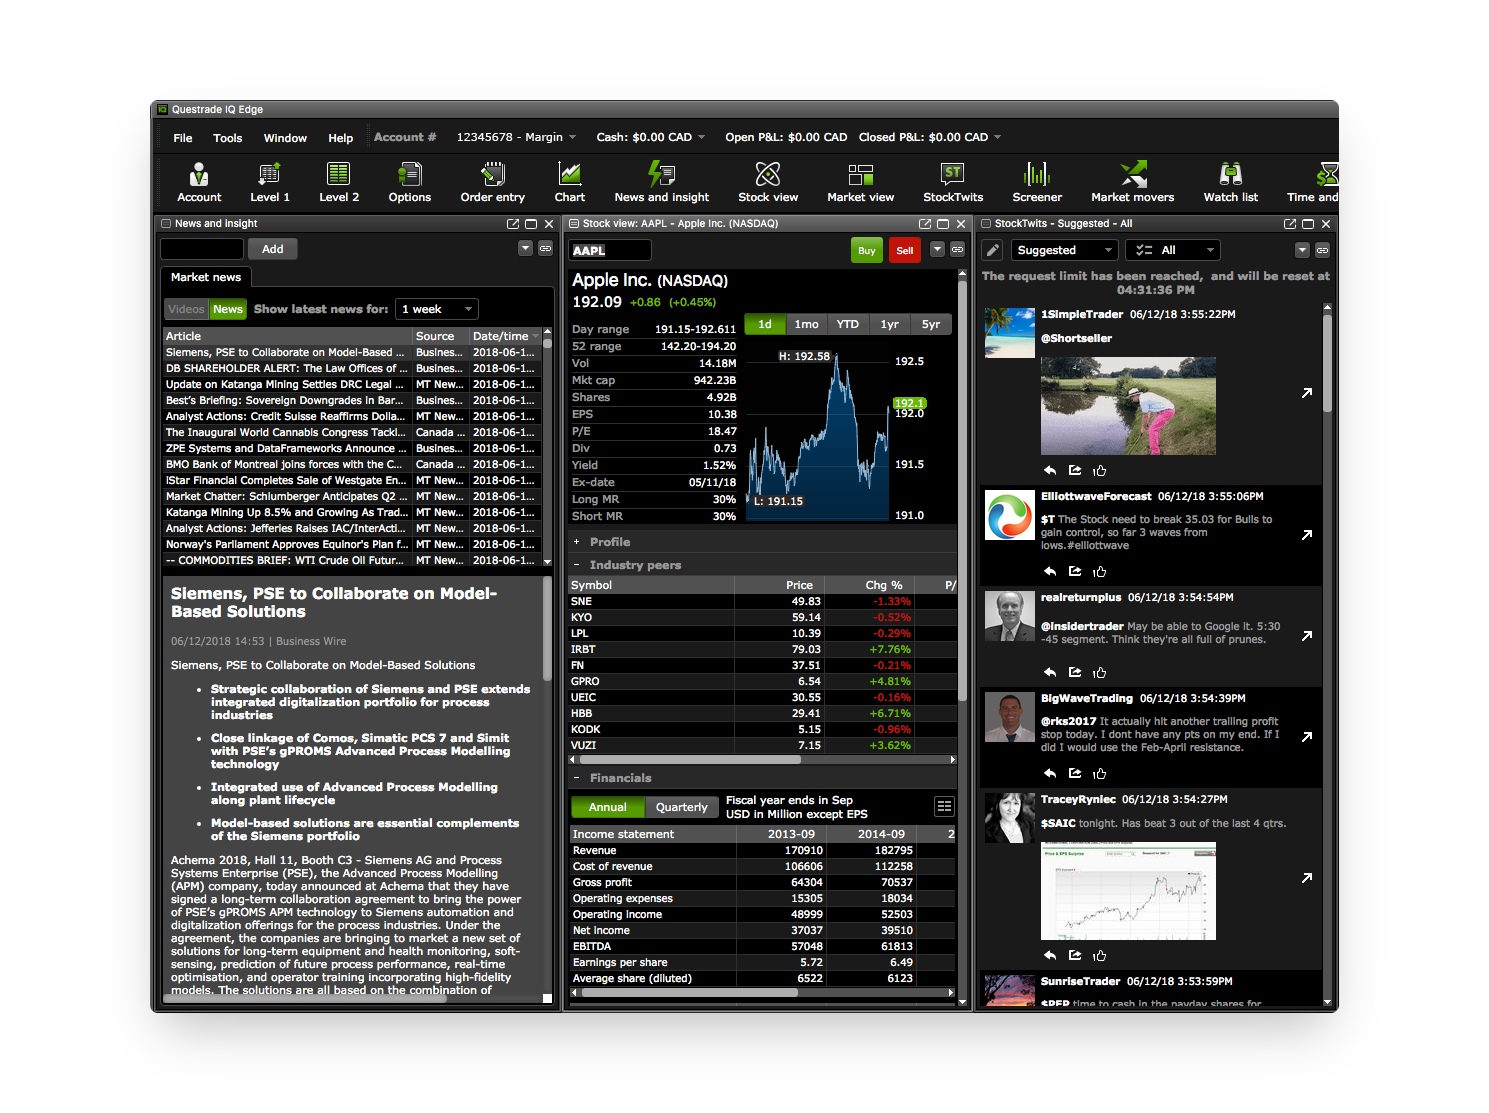
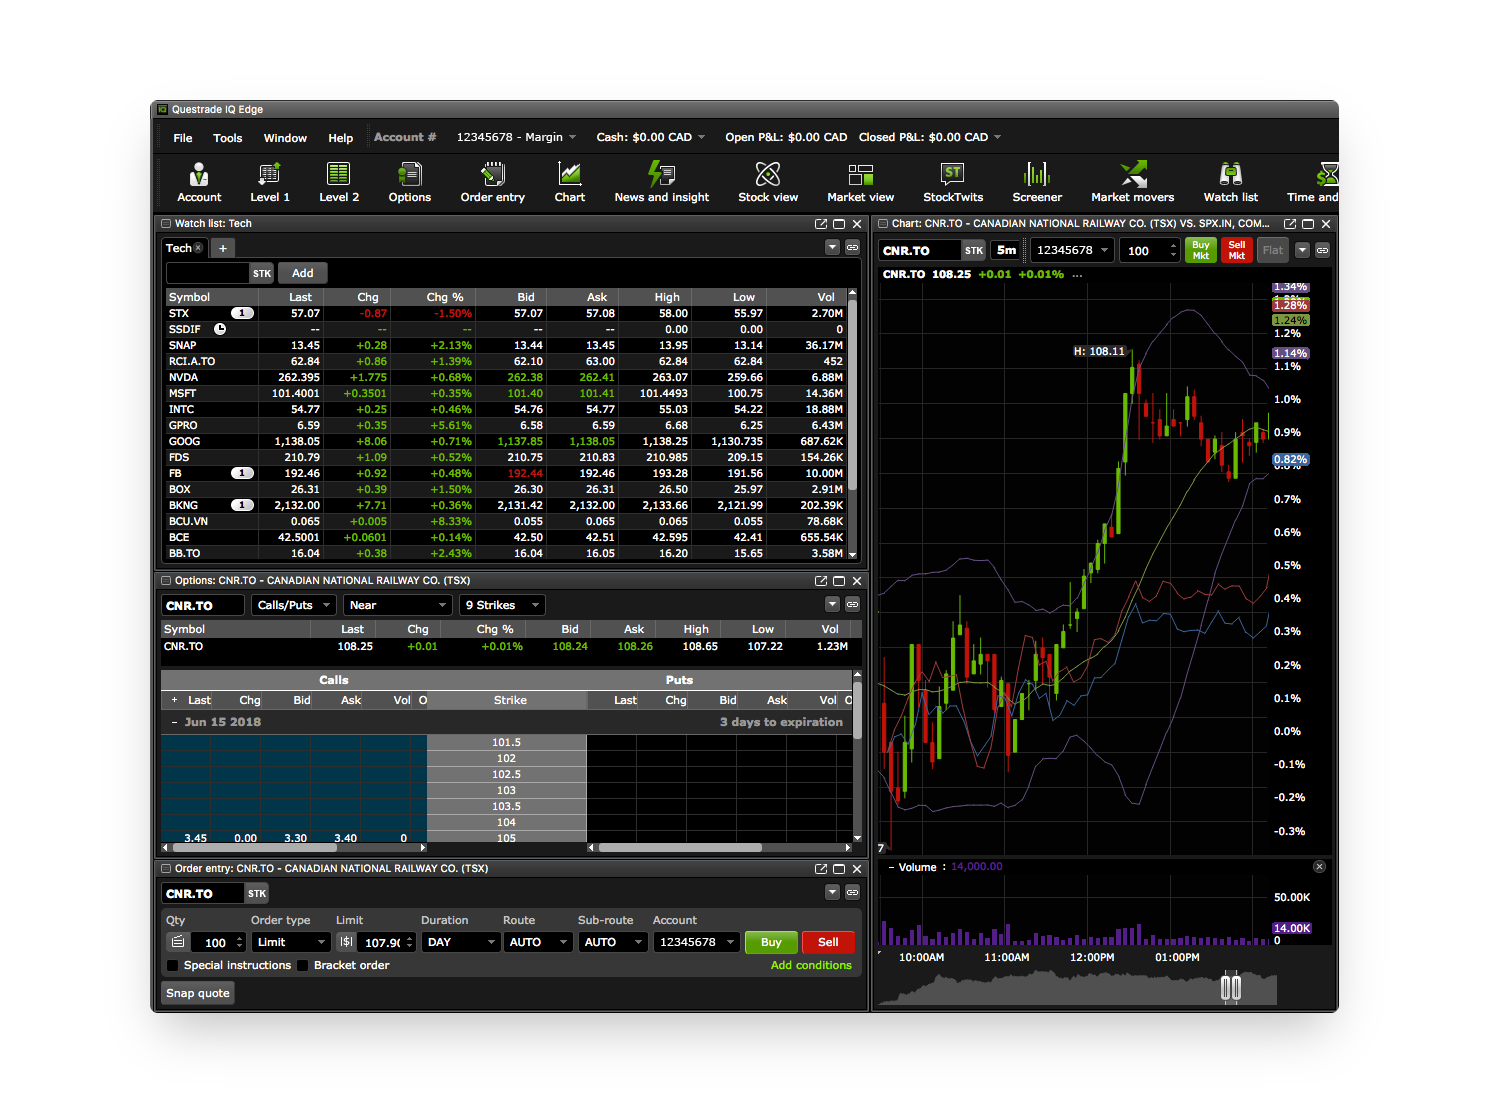
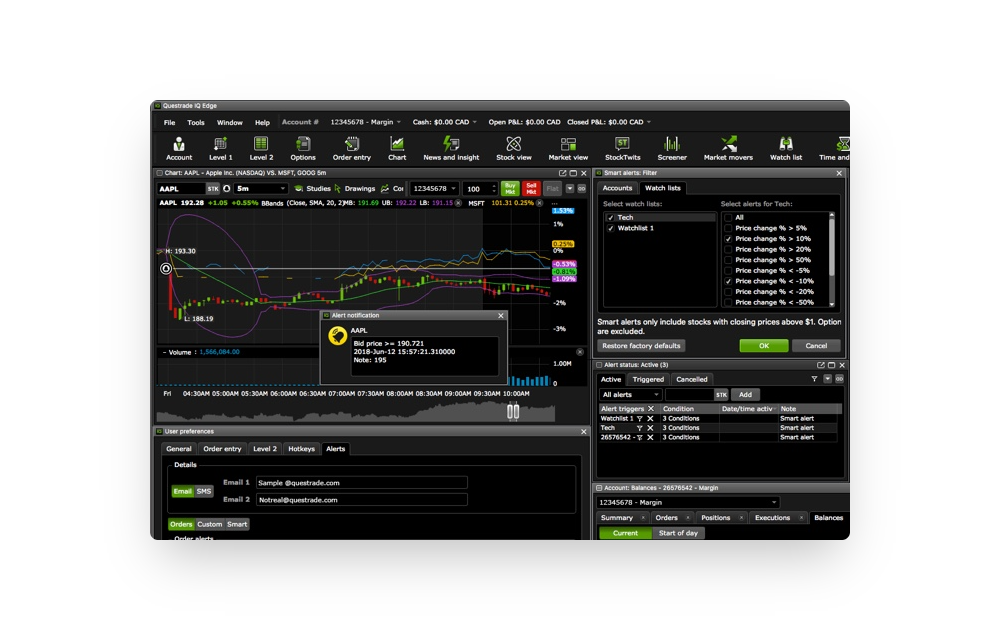
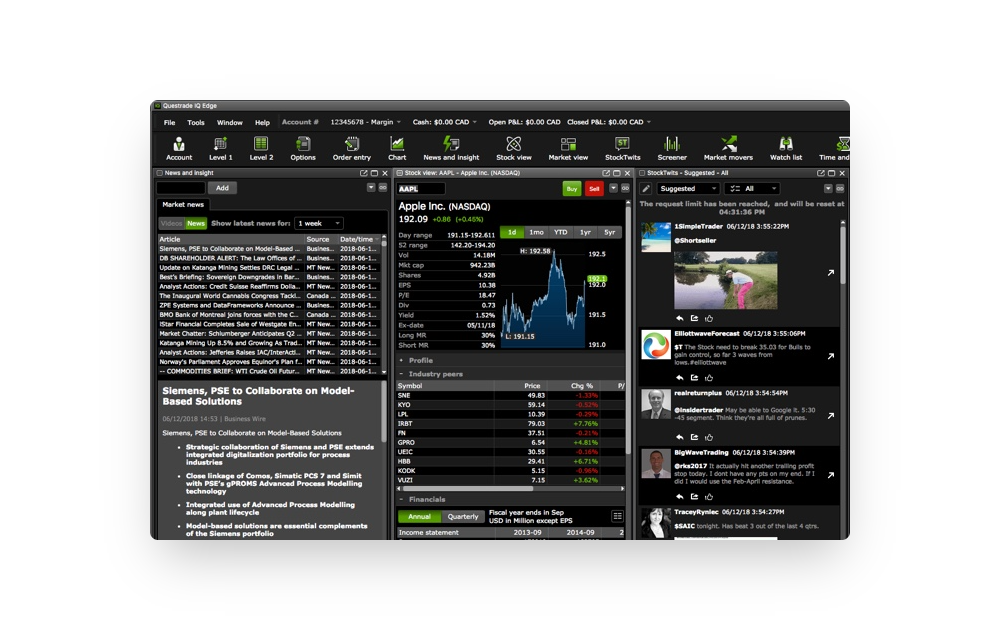
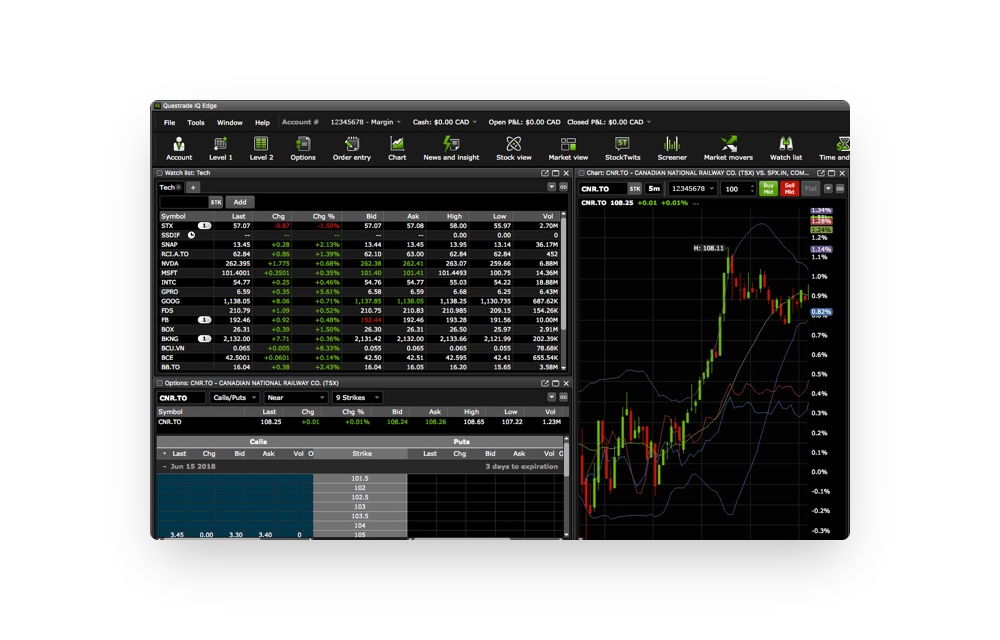
A tool like Market View provided various types of heat maps to evaluate best/worst performers – we designed the ability to filter those heat maps across exchanges so users could only see data that was relevant to them. Intraday Trader allowed users to scan and monitor market data or simply set up customized watchlists to trigger automated alerts based on algorithms that analyzed actionable opportunities. Stocktwits was integrated to enable users to view detailed stock analysis, but in a familiar Twitter-like feed. We designed more versatility into the economic calendar, allowing users to sort through various time frames and apply filters to refine data on IPOs, dividends, earning announcements, and other important events. Aside from designing research and analysis tools that could be used at various degrees of complexity, we designed an educational center that offered internal and third-party material to educate and aid the more novice user. We also designed customizable layouts that empowered users to setup their dashboard(s) with as much, or as little, data as they needed for their own investing needs, as well as predefined templates for those users who didn't need that level of customization.
Usability testing was another key to this project to ensure we were designing the right solutions for the right people. In the early stages of product design, we conducted explorative tests to brainstorm ideas with users and have them express their opinions on initial concepts. This proved especially critical for uncovering needs relating to data visualization and customization, and different personas’ comfort level with digesting various amounts of data. We also engaged users in card-sorting exercises to evaluate how they most naturally organized and structured the various features and data available to them in the product. As the design process progressed to prototyping, we engaged users in moderated usability sessions, evaluating and collecting feedback as users completed various tasks, and later unmoderated observation sessions to evaluate users’ feelings and comfort level using the product.